
PhDi – SOFTWARE PACKAGE FOR CALCULATIONS OF PHASE DIAGRAMS
(elaborated and developed by laboratory scientists)
The software package contains a database of thermodynamic properties for about 200 systems and a software based on a so called convex hulls approach.
The package enables computing of phase diagrams of
- unary systems in coordinates Temperature – Molar Volume (or Density) at fixed pressure and Pressure – Molar Volume (or Density) at fixed temperatures;
- binary systems in coordinates Temperature – Composition at fixed pressure and Pressure – Composition at fixed temperatures;
- multi-component quasi-binary and quasi-unary systems corresponding to cases above (e.g. ternary open systems at a given partial pressure of one of the components).
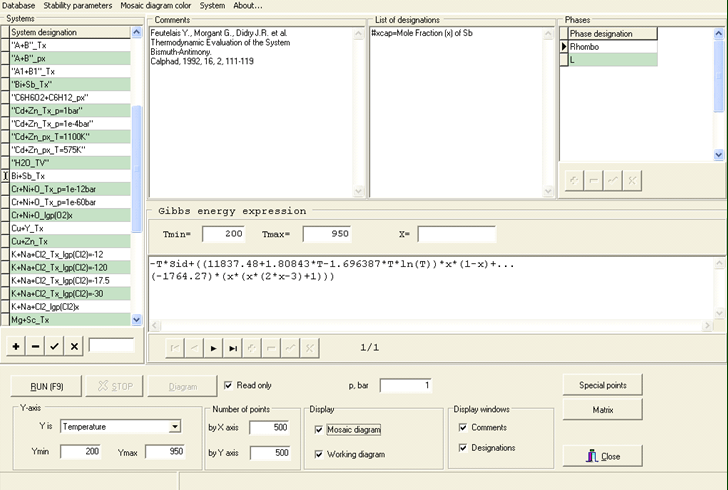
PhDi main window
In order to compute a phase diagram by means of convex hulls approach it is necessary either to enter or to select from the database values of thermodynamic potentials (Gibbs or Helmholtz energies) for all virtual phases of the system as functions of temperature, pressure, composition and etc. The computed diagrams correspond to thermodynamically stable states of the system. The results of calculations are presented in graphical form as well as coordinates of special points where the phase composition changes or monotonous character of lines describing equilibrium is violated.
The method used to develop the software is described in G.F. Voronin, Russian Journal of Physical Chemistry, Vol. 77, No 9, 2003, pp. 1543-1552. Its basic idea is as follows. Phase equilibrium is computed using the convex envelope of Gibbs energies of phases for various compositions of the system and given pressure and temperature. To that aim the computational geometry algorithm is used. Owing to that there is no need to solve the system of equations or find coordinates of constrained Gibbs energy minimum of the thermodynamic system. The solutions of components are presented in the software as a set of individual substances with various compositions and each of them has properties of the solution with corresponding composition. So the phase diagram is computed for user defined grid of points and the accuracy obtained is determined by density of the grid. The more points there are given for each coordinate the more accurate is result, but the more computer resources are necessary.
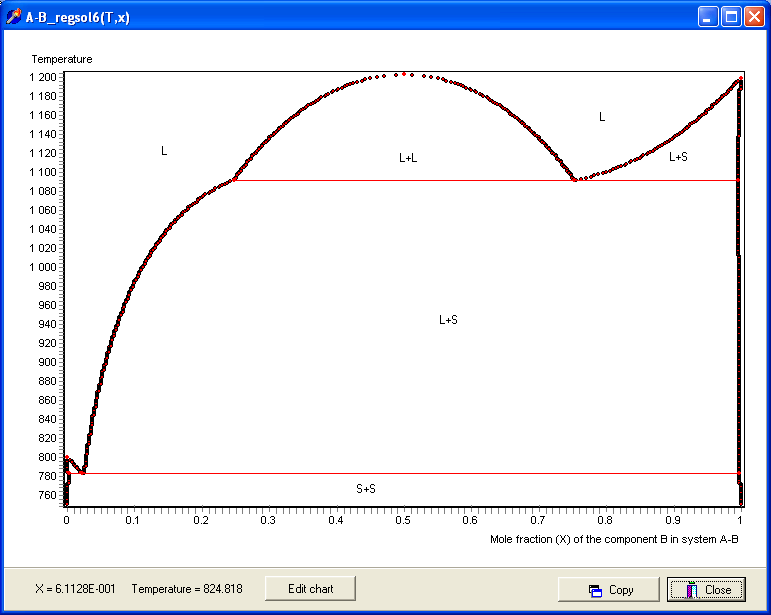
An example of computed phase diagram
The version of PhDi can not be used in case when expressions for calculation of Gibbs energy of phases has internal parameters, and computation of these parameters requires application of special procedures such as a function minimization or solution of a set of equations.
To download demo version the package (in English) please visit the Russian version of the laboratory web-site or click here.